
Classroom Resource – Exoplanets in a Box – Modelling exoplanet transits
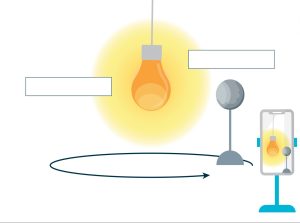
Brief description: During these activities, students will work in small groups to model the transit of an exoplanet in front of its host star using


 Brief description:
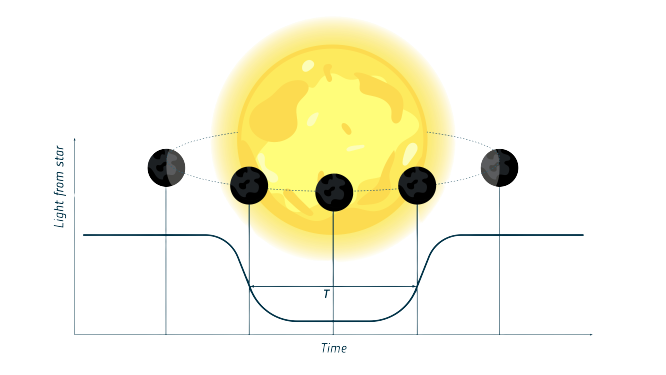
In this set of activities students will learn how scientists study exoplanets with telescopes, using the transit method.
Students will characterise exoplanets using model and real satellite light curves data from ESA’s satellite Cheops (CHaracterising ExOPlanet Satellite). They will practice data plotting and interpretation, and scaling of graphs in the context of exoplanet characterisation.
This activity is part of a series that includes “Exoplanets in Motion” where students build their own transit model and “Exoplanet in a Box” where students build a transit model inside a shoebox and calculate the size of an exoplanet.
Subject:
Science, Physics, Mathematics, Astronomy
Artist's impression of WASP 189 b orbiting a star
Brief description: During these activities, students will work in small groups to model the transit of an exoplanet in front of its host star using
Brief description: In this set of activities, students will learn how scientists study exoplanets with satellites like Cheops (CHaracterising ExOPlanet Satellite), using the transit method.