

Classroom Resource – Exoplanets in Transit – Characterising exoplanetary systems
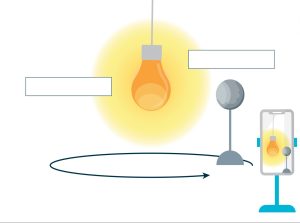
Brief description: In this set of activities students will learn how scientists study exoplanets with telescopes, using the transit method. Students will characterise exoplanets using