Cheops_illustration_pillars

Classroom Resource – Exoplanets in a Box – Modelling exoplanet transits

Brief description:

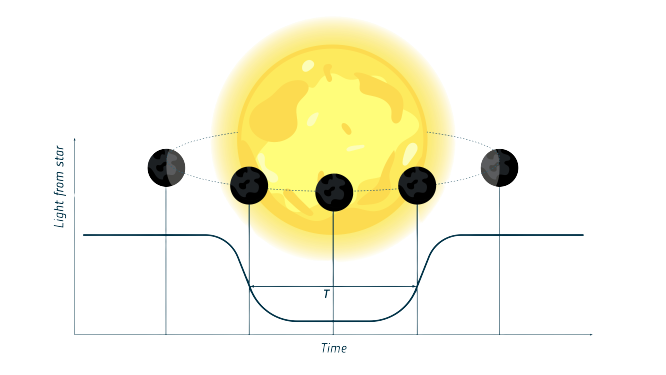
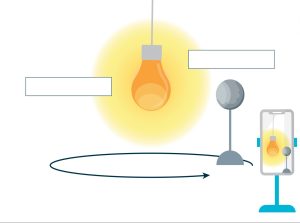
During these activities, students will work in small groups to model the transit of an exoplanet in front of its host star using an ‘exoplanet in a box’, and plot a light curve for this transit.

Students will develop their own experiment: they will decide which variables to measure, what parameters to keep constant, and what equipment they need to take measurements.

In addition, students will decide how to present their data and will develop their skills in data- logging and interpretation of graphs.

This activity is part of a series that includes “Exoplanets in Motion” where students build their own transit model and “Exoplanets in Transit” where students build a transit model inside a shoebox and calculate the size of an exoplanet.

Subject:
Science, Physics, Mathematics, Astronomy

Learning Objectives:

  • Understand the difference between a star and a planet.
  • Learn about the properties of exoplanets.
  • Understand how to model the detection of an exoplanet using the transit method.
  • Understand how to work scientifically.
  • Learn how to design an experiment.
  • Learn how to use data-logging equipment.

Age range:
14 – 19 years old

Time

Lesson: 90 minutes

Resource available in:

English

Activity 1: Exploring exoplanets

This activity introduces the students to the topic of exoplanets.

Following the activity, the students should be able to describe what an exoplanet is, give an estimate of the possible number of exoplanets in our galaxy, and give reasons as to why exoplanets are difficult to detect.
Equipment

  • Student Worksheet per pupil
  • Pen/pencil
Activity 2: Build your exoplanet in a box

The students will create their own physical model of a transiting exoplanet to understand how variations in observed light of the host star can be used to detect exoplanets (the transit method).

During this activity the students will learn how to use data logging applications and interpret graphs of observed light as a function of time.
Equipment

  • Student Worksheet per pupil
  • Pen/pencil
  • Cardboard shoebox, or similar box with lid
  • Torch
  • Light meter (e.g. smartphone with app or datalogger)
  • Craft knife / scissors
  • Semi-circular protractor
  • Clothes peg
  • Cocktail sticks or wooden BBQ skewer
  • White paper
  • Sticky tape
  • Modelling clay or similar

Did you know?

The Milky Way is estimated to contain a few hundred billion stars. Observations indicate that many stars host exoplanets, so it is likely that there are many billions of planets within our galaxy that are located in the star’s habitable zone.

Within our Solar System, scientists are investigating some of the moons of Saturn and Jupiter as good candidates for finding signs of life, such as Enceladus and Europa.

Artist's impression of WASP 189 b orbiting a star